
Best TradingView Indicator for Market Structure: A Practical Guide
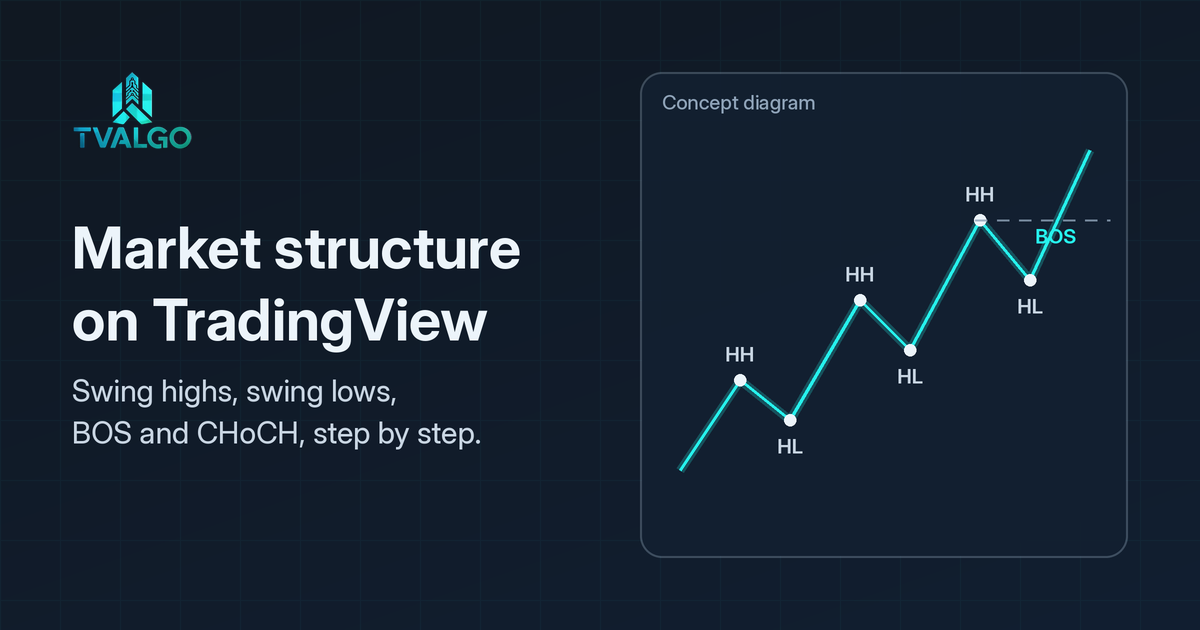
Market structure on TradingView is the sequence of swing highs and swing lows that price leaves behind. No single indicator "knows" that structure; a tool applies defined swing rules and may need later candles to confirm a turning point. If you are searching for the best TradingView indicator for market structure, judge whether a tool marks swings consistently, makes confirmation timing clear, and does not hide delay. This guide covers the underlying concept, criteria for comparing tools, common mistakes, and where TVALGO's tools fit alongside your own chart reading.
Key takeaways
- Market structure on TradingView is the sequence of swing highs and swing lows that price leaves behind.
- A break of structure continues the current trend; a change of character challenges it.
- A liquidity sweep briefly trades beyond a level and returns inside the range.
- Judge any structure tool by its swing rule, confirmation delay and label clarity.
- TVALGO's Sweeper Algo relates to sweep and displacement context; use it with your own structure reading.
What market structure means on a chart
Market structure describes how price moves between turning points. In an uptrend, price tends to print higher highs (HH) and higher lows (HL). In a downtrend, it prints lower highs (LH) and lower lows (LL). When neither pattern holds, the market is ranging between a recent high and a recent low.
For a closer look at telling those two conditions apart, see how to read trending versus ranging market regime on TradingView.
Traders usually describe changes in structure with two terms:
- Break of structure (BOS): price moves beyond the most recent swing point in the direction of the existing trend, for example closing above the last higher high in an uptrend. It suggests the trend is continuing.
- Change of character (CHoCH): price breaks the swing point that defined the trend on the other side, for example closing below the last higher low in an uptrend. It is an early warning that the trend may be weakening, not proof that it has reversed.
A third idea sits close to structure: the liquidity sweep. Many traders place orders just beyond obvious highs and lows. When price briefly trades through such a level and then returns inside the range, the move is often described as a sweep of the liquidity resting there. Reading whether a break holds or fails is a large part of practical structure analysis.
Break of structure, change of character and liquidity sweep
| Idea | What it describes | Typical read |
|---|---|---|
| Break of structure (BOS) | Price moves beyond the latest swing in the trend's direction | Trend continuation framework |
| Change of character (CHoCH) | Price breaks the swing that defined the trend on the other side | Possible shift in the prior swing sequence |
| Liquidity sweep | Price trades briefly beyond a level, then returns inside the range | Break-and-fail / stop-run style context |
Why traders look for a market structure indicator
Marking swings by hand works, but it is slow and inconsistent. Two traders looking at the same chart often mark different swing points, and the same trader may mark them differently on a busy day. An indicator applies one rule every time. That consistency is the real value: it makes your chart review repeatable, so you can compare today's structure with last week's on the same terms.
How to choose the best TradingView indicator for market structure
Use these criteria to judge any structure tool, whether it is a TradingView built-in, a community indicator or an invite-only one.
1. A clear, fixed swing definition
Every structure tool needs a rule for what counts as a swing high or low. Common rules use a number of bars on each side of a pivot. A small number marks many minor swings; a larger number marks fewer, more significant ones. Prefer tools that state their rule or let you set it, so you know what you are looking at.
2. Honest confirmation delay
A swing high can only be confirmed after price has moved away from it. If a tool needs five bars on the right side of a pivot, the swing appears five bars late. That is normal. What matters is whether the tool shows the swing at the bar where it was actually confirmed, or redraws history so that it looks as if the swing was known in real time. Scroll back through past candles and check how the marks behave as new bars form.
3. Readable labels
Good structure tools label HH, HL, LH, LL, BOS and CHoCH in a way you can read at a glance. If the chart becomes a wall of lines and labels, you will stop using it.
4. Multi-timeframe awareness
Structure on a 5-minute chart can be bearish while the 4-hour structure is still bullish. A useful workflow either shows higher-timeframe structure or makes it easy to switch timeframes and compare.
5. Context around levels
The swing points themselves are only half of the picture. The other half is what price does when it returns to them: does it break and hold, or break and snap back? Tools that help you study the reaction around key highs and lows add more than tools that only draw lines.
Built-in TradingView options for market structure
You can start with what TradingView already offers before paying for anything:
- Pivot Points High Low: a built-in indicator that marks pivot highs and lows using a left/right bar setting. It is a simple way to see swing points and to understand confirmation delay.
- Zig Zag: a built-in that connects significant swings once price has moved by a set amount. It is useful for seeing the overall sequence of highs and lows, but its most recent leg can change until it is confirmed.
- Manual drawing tools: horizontal lines and rays on the latest swing high and low are still the clearest way to learn structure.
Community indicators add automatic BOS and CHoCH labels. Their quality varies, so apply the criteria above to each one.
A worked example (illustrative)
Imagine a 1-hour chart in an uptrend. Price has made a higher low, rallied to a new high, and pulled back. Your swing rule confirms the pullback low a few bars later; that becomes the latest higher low. Two outcomes are worth studying:
- Price returns above the last high and closes there. That is a BOS in the direction of the trend, and the structure remains bullish.
- Price trades briefly above the last high, fails to close above it, and falls back into the range. That looks like a sweep of the liquidity above the high. If price then closes below the latest higher low, you have a CHoCH: a warning that the uptrend may be losing control.
Neither outcome tells you what will happen next. Structure gives you a framework for describing the market and for deciding where your idea is wrong, which is where risk management starts.
Common mistakes with market structure tools
- Treating every label as a trade. A BOS or CHoCH label is a description of past price action, not an instruction.
- Mixing timeframes without noticing. A lower-timeframe CHoCH inside a higher-timeframe uptrend is often just a pullback.
- Ignoring the swing setting. Changing the pivot length changes every label on the chart. Pick a setting and keep it while you review.
- Judging a tool by hand-picked screenshots. Scroll through many weeks of history, including choppy ranges, before you trust any structure tool.
Where TVALGO fits in a market structure workflow
TVALGO is a set of five tools for TradingView. The one that relates directly to structure work is Sweeper Algo, through market sweeps: see how Sweeper Algo marks market sweeps.
To compare your own structure reading with a second view, you can analyse a chart screenshot with the TVALGO Chart Analyzer: upload one chart and it sets out the trend, market structure and key levels for you to check on your live chart.
Sweeper Algo is built to identify market sweeps and strong price displacement. It marks BUY or SELL entries after confirmation, which relates closely to the "break and hold or break and snap back" question described above. Its settings are adjustable and need testing before live use.
The other four tools cover different questions: the SIX Algo Oscillator for momentum and extreme-zone context, Bottom Killer (long-only) for oversold reversal areas, Quantum Forge for rule-based, condition-based entries with a Long/Short/Both direction filter, and Market Predator for reaction zones and BUY/SELL signals. Every TVALGO plan includes all five tools. Like any trading tool, they are analysis aids to combine with your own structure reading and risk rules, not a replacement for them. Their settings are adjustable and need testing before live use. If you want to learn how extreme zones fit alongside structure, read our guide to overbought vs oversold on TradingView.
Access works through your TradingView account: TVALGO tools are delivered to the exact TradingView username you provide, so you need a TradingView account before you subscribe. Access is added to your TradingView username within 12 hours of successful payment and username validation.
Compare TVALGO access plans or explore all five tools.
For further reading on paid invite-only suites that also cover structure-style tools, see LuxAlgo alternatives.
FAQ
What is the best TradingView indicator for market structure?
There is no universal best. The best choice is a tool with a clear swing definition, honest confirmation timing, readable BOS and CHoCH labels and enough context to study how price reacts at key highs and lows. Test any candidate on many weeks of history before relying on it.
Is there a built-in market structure indicator on TradingView?
TradingView includes Pivot Points High Low and Zig Zag, which mark swing points. Automatic BOS and CHoCH labelling usually comes from community or invite-only indicators.
What is the difference between a break of structure and a change of character?
A break of structure continues the current trend by moving beyond the latest swing in that direction. A change of character breaks the swing that defined the trend on the opposite side and is an early sign that the trend may be weakening.
How is a liquidity sweep different from a breakout?
In a breakout, price moves beyond a level and holds there. In a sweep, price trades through the level briefly and returns inside the range. You only know which one happened after the move develops.
Does market structure work on every market and timeframe?
The concept applies to any liquid market TradingView charts, from forex and gold to crypto and stocks, including Pakistan Stock Exchange symbols. Lower timeframes produce more swings and more noise, so many traders read higher-timeframe structure first.
This article is for educational purposes only and is not financial advice. TVALGO provides technical-analysis software; it does not guarantee results, execute trades or provide personalised advice. Trading involves risk, and you can lose money. Read our risk disclosure before using any trading tool. TVALGO is independent and is not affiliated with or endorsed by TradingView.