
Overbought vs Oversold: How to Read Extreme Market Zones on TradingView
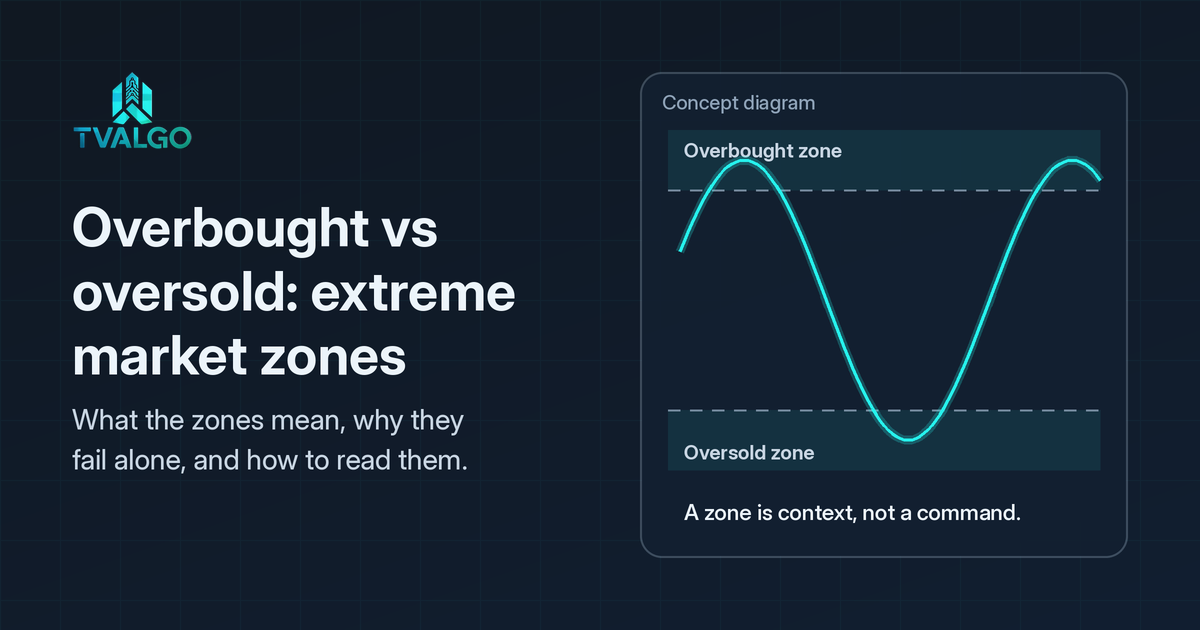
Every trader has seen it: price runs hard in one direction, the oscillator pins near the top of its range, and the chart seems to shout that a reversal is due. Sometimes it is. Often it is not. Learning to read overbought and oversold readings properly is one of the most useful skills you can build on TradingView, and one of the most misunderstood.
What overbought and oversold actually mean
"Overbought" and "oversold" describe where price sits relative to its own recent behaviour. They do not mean an asset is too expensive or too cheap. An overbought reading says buying pressure has been unusually strong for the lookback period. An oversold reading says the same about selling pressure.
Most momentum oscillators turn this into a bounded scale. The Relative Strength Index (RSI) runs from 0 to 100, with 70 and 30 as the common extreme levels. The Stochastic oscillator uses 80 and 20. When the line enters those bands, the market has entered an extreme zone.
Overbought vs oversold indicator readings: the difference at a glance
If you are asking “what is overbought vs oversold?”, compare the direction of unusually strong pressure within the oscillator's lookback period, not whether an asset is expensive or cheap. Oscillators such as RSI and Stochastic use upper and lower bands to show these extremes. Adjusting their settings can change how often the bands are reached.
| Reading | What it describes | What it does not mean |
|---|---|---|
| Overbought | Buying pressure has been unusually strong over the selected lookback period. | Price is too expensive or must start falling. |
| Oversold | Selling pressure has been unusually strong over the selected lookback period. | Price is too cheap or must start rising. |
Neither label predicts a turning point: in a strong trend, an extreme can persist. The same reading means something different in a trend than in a range, so use the checklist below to assess its context.
Why an extreme reading is not a signal on its own
The most common mistake is treating every extreme reading as an instruction to sell or buy. In a strong trend, an oscillator can stay overbought for days or weeks while price keeps climbing. Selling simply because the line crossed 70 means trading against the strongest move on the chart.
An extreme zone is better treated as a question than an answer. It tells you the move is stretched. It does not tell you the move is finished. Pair that reading with how swing highs and lows define market structure on TradingView before treating any extreme as a turning point.
If you are studying possible turning points rather than the extreme reading itself, see the guide to reversal indicators on TradingView.
A five-step checklist for reading extreme zones
- Check the higher timeframe. An oversold reading on the 15-minute chart inside a daily uptrend is a very different setup from the same reading in a daily downtrend. Many traders study extremes in the direction of the bigger trend first.
- Wait for momentum to turn. Instead of acting the moment the line enters the zone, wait for it to curl back out. A cross back below the upper band, or above the lower band, shows pressure is actually fading.
- Look for divergence. If price makes a new high but the oscillator makes a lower high, momentum is weakening underneath the move. Divergence at an extreme is far more meaningful than the extreme alone.
- Confirm with structure. Extremes that line up with a support or resistance level, a previous swing high or low, or a liquidity sweep carry more weight than extremes in the middle of nowhere.
- Define your risk before you act. Decide where the idea is wrong and how much you are willing to lose before entering. Extreme zones can extend further than anyone expects.
Common mistakes to avoid
- Using default settings on every market and timeframe without checking how they behave.
- Ignoring repainting. Some indicators change past values after the fact, which makes historical signals look cleaner than they really were.
- Stacking several oscillators that all measure the same thing and treating them as independent confirmation.
- Reviewing only the trades that worked. Study the extremes that failed, too.
Where the SIX Algo Oscillator fits
The SIX Algo Oscillator, one of the five tools in the TVALGO toolkit, was built around this way of reading the chart. It shows momentum as colour-coded bars: green for buy pressure, red for sell pressure and orange for potential reversal zones. Readings above +1 and below −1 mark strong bull and bear zones, and TVALGO uses these extremes to highlight zones near highs and lows. TVALGO states that the oscillator does not repaint, and its alerts trigger only when the candle closes, so past candles should match what the tool showed at the time. You can check this yourself by scrolling back through past bars and studying how the readings behaved bar by bar.
Like any oscillator, it is typically used as one part of a process: combined with trend, structure and clear risk rules rather than used as a stand-alone buy or sell button. Every TVALGO plan includes all five tools in the toolkit. You can compare the plans here.
The bottom line
Overbought and oversold readings are context, not commands. Use them to spot where a move is stretched, then let trend, momentum shifts, divergence and structure decide whether there is a trade at all.
Frequently asked questions
What is the difference between overbought and oversold?
Overbought means buying pressure has been unusually strong over an oscillator's lookback period; oversold means selling pressure has been unusually strong. Neither says an asset is objectively expensive or cheap, and neither predicts a reversal. A reading can remain extreme during a strong trend, so consider the wider chart context.
This article is for educational purposes only and is not financial advice. Trading involves risk, and you can lose money. Read our risk disclosure before using any trading tool.