
Best TradingView Indicator for Support and Resistance: A Guide
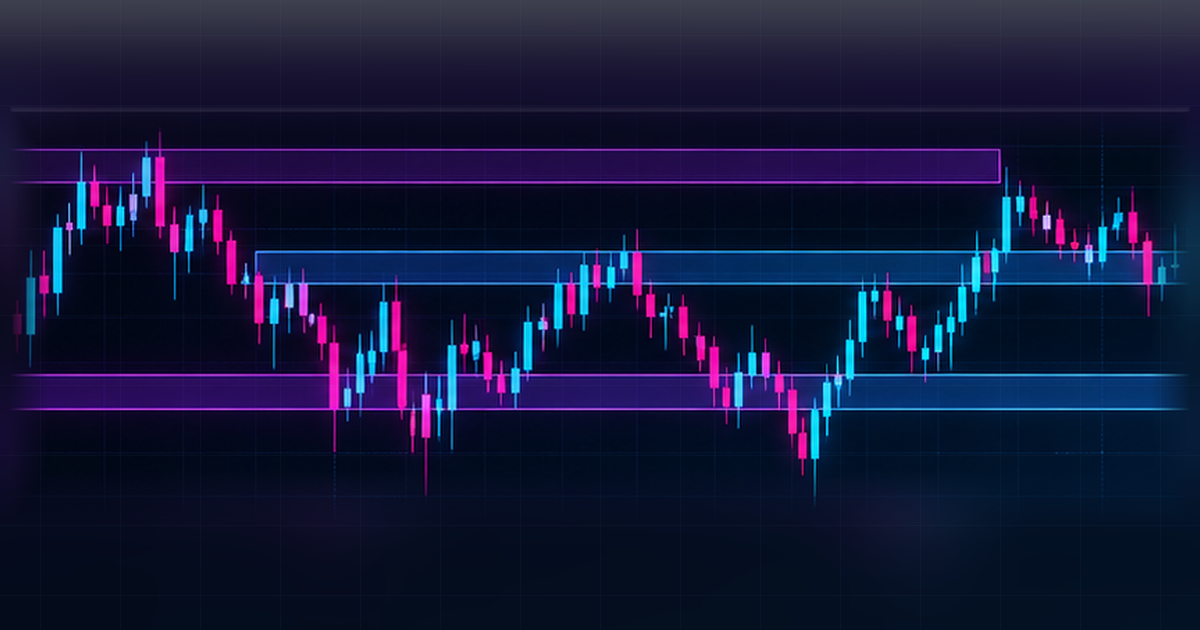
The best TradingView indicator for support and resistance is one that makes the origin and timing of its plotted levels clear. Support and resistance describe areas where price previously reacted, not barriers that must hold in the future. A level drawn from confirmed pivots, a prior session range or a moving average may look similar on screen while being calculated in very different ways. This guide shows how to compare those methods without confusing a historical observation with a forecast.
Key takeaways
- Define one question before choosing a chart study.
- Compare behaviour across more than one market condition.
- Check exactly when a marker or reading becomes available.
- Keep tool settings, feed and timeframe consistent.
- Review past bars and use forward observation without relying on hindsight.
What does support and resistance mean on a chart?
Support and resistance are labels for historically observed areas of attention, not physical walls. A trader might mark places where a prior decline paused, a previous advance stalled or a cluster of swings occurred. These marks are descriptive. Different people can draw slightly different boundaries from the same candles, particularly when using wicks instead of closes. Begin by stating your rule before drawing anything: for example, a level may come from a confirmed swing extreme or a defined session range. Then see whether another reader could reproduce it. If the method depends on unspoken judgement, an automated overlay may seem more precise than it really is. Keep in mind that repeated historical reactions do not prove a level will be meaningful later. Use the drawn area to organise analysis, not to replace independent judgement. For the swing sequence that often sits behind those zones, see how to read market structure on TradingView charts.
Should levels be drawn as lines or broader zones?
A thin horizontal line is easy to compare with earlier candles, but it can imply more precision than the underlying observation supports. A zone makes room for nearby reactions, yet a zone that is too wide can encompass nearly everything. Decide what a level represents before deciding how it should look. If the purpose is to label a previous swing high, a line at that observed point may be appropriate. If the purpose is to summarise a cluster of turning candles, a clearly bounded region can be easier to interpret. Choose a consistent rule for using candle bodies, wicks or both. Do not widen a zone retrospectively every time the chart fails to respect its earlier boundaries. Record the original drawing and the method that produced it.
How do automated pivot studies produce levels?
Pivot-based tools commonly use a configured number of earlier and later candles to confirm a local high or low. This creates an important timing distinction. The historical pivot may be drawn at the candle where the extreme occurred, even though it was confirmed only after later candles closed. A finished chart can therefore make the placement look more immediate than it was. Inspect the right-side lookback or confirmation setting and test a sample by stepping through candles one at a time. Record the pivot candle and the confirmation candle separately. If the display extends a level forward after confirmation, note when the extension began. A thoughtful evaluation is less interested in whether an old line looks tidy and more interested in whether a reader can reconstruct the information available at that moment.
What is the difference between static and dynamic levels?
Static levels normally remain anchored to a defined past observation, such as a previous period’s high or low. Dynamic references recalculate as candles arrive, often using a moving average or another rolling formula. Both may be called support and resistance in general trading discussion, but they are not the same type of chart object. An updating average can move even while no historic swing level has changed. If you compare the two, make sure you know whether the reading is fixed for the session, final at candle close or continually updated. Never judge them as interchangeable simply because a market reaction happened near each one in a screenshot. A clear label for the source of every level helps prevent mistaken conclusions.
Static levels, dynamic levels and zones
| Approach | How it is built | What to check |
|---|---|---|
| Static level | Anchored to a defined past observation (prior high, low or session boundary) | Origin candle and whether the level was available at the time |
| Dynamic level | Recalculates as new candles arrive (for example a moving average) | Whether the line moved after the fact on completed bars |
| Zone | A band around a historical area of attention rather than a single price | Whether the width matches how the candles actually clustered |
How should you choose a timeframe for levels?
A level drawn from a weekly chart may describe a different scale of historical activity from a level on a short intraday chart. When several intervals are overlaid, the display can quickly become crowded. Start with the timeframe associated with the question you want answered, then add higher-interval context only if it contributes an independently useful reference. Check how a study aligns daily or weekly bars with your chart’s timezone and exchange feed. If it uses a previous-day high, confirm what “day” means on that symbol. Record whether a line is recalculated at the start of a period or updated during it. This basic timing check is often more valuable than changing the colours or thickness of the plotted level.
Which visual mistakes make these tools hard to use?
One common problem is filling the chart with every historical pivot, leaving no hierarchy of importance. Another is placing labels over active candles, making the market data difficult to read. A third is using similar colours for levels from different timeframes, which hides the origin of each mark. A fourth is retrospectively moving a line to match the most recent swing without recording the change. Evaluate the chart in grayscale or with simplified colours to see whether labels and boundaries remain understandable. Hide half the overlays and ask what information is actually lost. If removing a group of lines changes nothing you can explain, they may be clutter rather than useful context. A well-designed tool leaves the candle sequence legible.
How can you test whether a marked zone was available at the time?
Rewind the chart to a historical point before a suspected reaction. Let only the candles available then be displayed. Apply the level-drawing method and write down the reference, calculation window and time the line appeared. Progress through completed candles without moving the zone by hand. Later, compare the original note with the final chart. This detects both calculation delays and hindsight editing. Include examples in which price passes through the historical area without an obvious pause; omitting them creates a misleading picture. For manually drawn zones, save the drawing as first made instead of cleaning it up after the fact. For automated studies, note the version and configuration so the output can be reconstructed.
How to test any support-and-resistance tool
Define a level source: confirmed pivots, prior session boundaries or a rolling measure. Record your feed, timezone and timeframe. When reviewing past bars, check when the level actually becomes visible and whether it later moves. Compare thin lines with defined zones while keeping the same underlying rule. Examine several market conditions and retain examples where the level appears unhelpful. Forward-observe the unchanged configuration on a demo chart. Keep a journal of clarity, missed labels, candle obstruction and unexpected historical revisions. If you later examine a full trading process, assess costs and execution separately; those are outside the claim of an individual visual overlay. No drawing should be treated as a promise that a future candle will behave in a certain way.
Where do TVALGO tools fit?
TVALGO offers access to five analytical tools on TradingView charts: SIX Algo Oscillator, Market Predator, Bottom Killer, Sweeper Algo and Quantum Forge. The product names should not be confused with a promise that every tool automatically plots particular support or resistance levels. Evaluate the precise description and current settings of any selected tool before incorporating it into a chart routine. If you want a second view of the levels on a chart you have already marked, you can upload a chart screenshot to the TVALGO Chart Analyzer, which reads key levels from the price scale for you to check against your own zones. This guide treats support and resistance as a general chart-analysis topic, separate from unsupported feature assumptions. The catalogue is available at https://tvalgo.com; the responsibility for interpreting the chart remains yours.
What is the simplest useful review workflow?
Keep one clean chart and mark only the historical levels needed to answer a defined question. Label each level with its origin and relevant timeframe. Choose whether it is a line, a bounded zone or an updating reference and make that choice consistently..
Frequently asked questions
Is a horizontal line enough to mark support and resistance?
A horizontal line can represent a defined past level, such as a confirmed swing extreme. It is easy to interpret but may imply more precision than the candles justify. Use a consistent method for selecting the level, and consider a bounded zone when several nearby reactions matter.
Why does a pivot level appear after the turning candle?
A pivot tool may need later candles to confirm that the earlier candle was a local extreme. It can then draw the mark at the original candle, even though confirmation arrived later. Step through the chart candle by candle and record both times so the historical picture is not mistaken for immediate information.
Are support and resistance zones always horizontal?
No. Some studies display a moving reference derived from a rolling calculation, while manually drawn historical zones often remain horizontal. These are different analytical objects. Check whether the plotted reference is anchored to a past event or recalculated as new candles arrive before deciding how to interpret it.
Which timeframe makes a level more important?
There is no universal importance rule that applies to every chart. A higher-interval level summarises a broader period, while a lower-interval level describes finer detail. Choose the interval that fits your research question, label it clearly and avoid stacking so many levels that the candles disappear.
How can I tell if a support-and-resistance tool repaints?
Save its display at a known completed candle, then revisit the same chart after more candles form. Compare level positions, labels and confirmation timing. Some studies deliberately wait for later candles before marking a pivot. Separate that normal delay from unexplained historical rewriting and document the difference.
Do historical reactions mean the level will hold again?
No. A historical reaction records what happened in the visible data, not what another candle must do. Keep examples where the market crosses a marked area without a clear pause. A useful level-making method should be repeatable and transparent even when the subsequent chart is unremarkable.
Conclusion
Choose a method you can explain, document and check again after new candles arrive. Compare the chart with and without the study before allowing it to influence your research routine. Clear evidence about when information was visible matters more than a persuasive screenshot. Explore the TVALGO catalogue at https://tvalgo.com.
Educational content only, not financial advice. Trading involves risk, and no analytical tool can guarantee profits or prevent losses. TVALGO is independent and is not affiliated with TradingView.