
Buy Sell Indicator on TradingView 2027: Test First
There is no single best buy sell indicator on TradingView for 2027. Choose a tool with signals confirmed on candle close, then test whether they remain on the chart using live observations, timestamps, closed-candle screenshots and alert history. Repeat the test on the market and timeframe you actually use.
- Prefer candle-close confirmation when you need a stable historical record.
- Compare live signals with the chart after later bars have formed.
- compare closed-candle screenshots and alert history as cross-checks.
- Choose tools for distinct information, not for the number of markers.
Quick answer: the best buy sell indicator on TradingView for 2027
The practical choice is a tool with clear rules, signals that remain consistent after candle close, and behaviour tested on your symbols and timeframes. Before choosing one for 2027, check how it handles unfinished candles and whether its historical chart matches your live observations.
Buy sell signals on TradingView: what they are (and are not)
Buy and sell signals are chart markers or alerts produced when a tool's rules are met. Those rules may use price, momentum, volatility or moving averages. A marker shows that conditions occurred; it does not decide whether a trade is suitable.
Our guide to judging buy and sell signals on TradingView covers the wider topic. For separate price context, see our guide to market structure on TradingView. Here, the focus is whether a signal stays consistent after the candle closes.
Check the calculation and confirmation rule, not just the marker's colour or shape. Does it use the unfinished candle, wait for confirmation, and match what appeared in real time?
Candle-close signals vs live-bar signals
A live bar is the candle currently forming. Its high, low and close can change until the interval ends. If a tool evaluates that unfinished bar, a marker may appear, move or disappear before the close.
A candle-close signal is confirmed only after the bar has finished. This makes its confirmation point clearer, but does not tell you what the next candle will do.
| Question | Live-bar signal | Candle-close signal |
|---|---|---|
| When does it appear? | While the current candle forms. | After the candle closes. |
| Can it change? | Yes, as the unfinished candle changes. | It should remain tied to the closed bar. |
| When may an alert fire? | During the candle, depending on its rule. | At the close, when configured for bar-close confirmation. |
| How can it look in history? | A temporary marker may no longer appear. | The confirmed marker should remain on its candle. |
| What should you test? | Capture it live, then compare later. | Check the close time, chart and alert record. |
| Main trade-off? | Earlier indication, with more opportunity for change. | Clearer confirmation, but only after the candle ends. |
Why a live-bar signal can vanish
Price can move back across a condition that was briefly satisfied during a live candle. A marker based on that unfinished bar can disappear or shift when the candle updates. Repainting is the broader issue where real-time output differs from what later appears on the same historical bars.
Other causes can include unconfirmed higher-timeframe data or pivot logic that marks a point only after later candles form. What matters is what appeared at the time, not only what the chart shows afterwards.
What "confirmed on candle close" means
The tool waits until the current candle has finished before confirming a signal. The marker or alert is not final while the bar is changing. This makes later comparison easier, but it cannot guarantee that the next move will follow the signal.
How to test a buy/sell indicator for repainting yourself
Do not rely only on a product description or a chart image selected after the event. Use the same repeatable check on any tool, market and timeframe you are considering. Keep the settings consistent during the test.
- Choose a test chart. Select the symbol and timeframe you use. Record the tool and its settings.
- Watch signals live. When a marker appears on a forming candle, capture the chart, symbol, timeframe and visible time. Note that the candle is still open.
- Wait for the close. Record whether the marker remains, moves or disappears. Do not count a temporary live marker as confirmed.
- Compare later. Return after several more bars and compare the historical chart with your timestamped screenshots. Check whether the marker remains on the same candle.
- Compare closed-candle screenshots. compare saved screenshots of completed candles with the chart as it stands now. Compare this with your live notes. Availability of historical chart tools and options can depend on your TradingView plan; check your plan.
- Review alert history. Compare recorded alerts with the chart now shown. Check the condition and whether the alert was set to fire once per bar close.
Repeat in different market conditions; a quiet range and a fast move may behave differently. One example cannot establish general behaviour.
Live screenshots and timestamps
A useful screenshot identifies when it was taken and whether the candle was forming. Include the symbol, timeframe and visible chart time. Record which clock you used and keep it consistent. In Pakistan, PKT is UTC+5 throughout the year.
Capture the marker when it first appears, then after the candle closes. Avoid cropped images that hide the candle boundary or timeframe.
Closed-candle consistency check
Save screenshots of completed candles and compare them later with alert history where available. It is a second check, not proof by itself; availability and controls can depend on your TradingView plan and chart setup.
Compare those historical bars with screenshots from the original live session. A final historical chart cannot reconstruct every detail of an unfinished candle.
Alert history check
Alerts provide a timestamped record of when a condition triggered. Compare it with the candle and marker now visible. An alert received before the close may represent a live-bar condition.
Check the alert frequency and choose once per bar close where that option is available and suits your test. Menu labels and options can vary by TradingView version or plan.
Setting alerts so they match the closed candle
Open the chart's alert controls and select the relevant tool condition. Review the frequency before saving. For a confirmed candle-close alert, choose once per bar close if it is offered for that condition.
Options may vary by tool, chart setup or TradingView version. Read the alert summary, then compare its timestamp with the candle close and chart marker. If it fires while the candle is forming, review the frequency and condition.
Is there a "most accurate" buy/sell indicator?
No tool is universally the most accurate. The answer depends on how you define a correct signal, the market and timeframe, the test period, and whether your evaluation includes spreads, fees, slippage and missed signals. A chart image or a few examples cannot settle it.
Define the test before reviewing results: what counts as a signal, when it becomes confirmed, which period you will assess and how you will record outcomes. Apply the same rules across tools and do not change settings just because one historical section looks better.
How TVALGO's tools fit
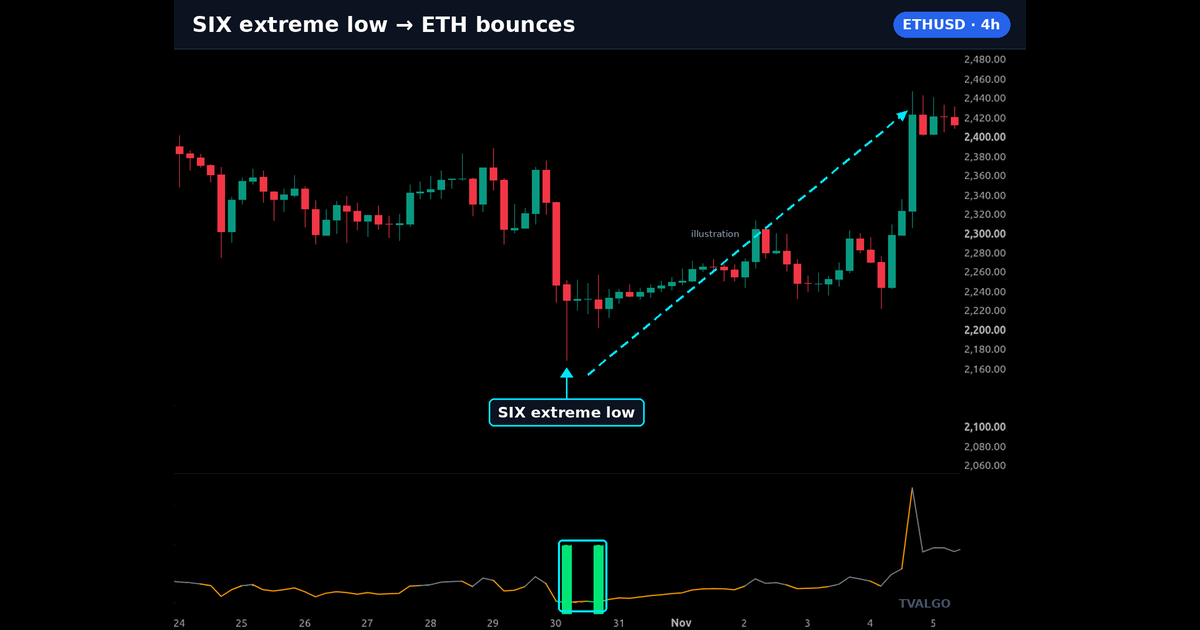
Market Predator plots Buy / Sell signals and highlights key reaction zones; its page advises using your own confirmation. Sweeper Algo marks Buy / Sell entry markers after confirmation using next-candle logic. SIX Algo Oscillator alerts trigger only when the candle closes. Bottom Killer plots Buy markers using long-only logic. Quantum Forge acts only when specific conditions are met.
Run the same live screenshot, candle-close, closed-candle screenshots and alert-history checks on your charts. All five run on TradingView charts, work on free and paid TradingView plans across markets and timeframes, and have adjustable settings that need testing. Access is added to your TradingView username within 12 hours of successful payment and username validation. See the five TVALGO tools.
Frequently asked questions
What is the best buy sell indicator on TradingView for 2027?
There is no single best choice for every market or timeframe. For 2027, look for clear confirmation rules, preferably signals confirmed on candle close, and test whether markers remain consistent using live screenshots, closed-candle screenshots and alert history on the charts you use.
What was the best buy sell indicator on TradingView in 2026?
There was no universal answer in 2026 either. Tools use different calculations and confirmation rules, and behaviour depends on the market and timeframe. Record signals live, compare them after candle close and review alert history before choosing one.
Is there a best buy sell indicator on TradingView without repainting 2026?
No single tool is best for everyone. To assess repainting, capture live markers with timestamps, check them after the candle closes, compare them against closed-candle screenshots and review alert history.
What is the most accurate buy/sell indicator in TradingView?
No tool is universally the most accurate. Results depend on the definition of a correct signal, symbol, timeframe, test period and trading costs. Compare tools using the same rules and a broad sample; selected screenshots or a few signals are not proof.
Why did a buy/sell signal disappear from my chart?
The signal may have been calculated while the candle was forming. Price then changed before the close, so the condition was no longer met. Check whether the tool confirms on candle close and whether the related alert was set to wait for a bar close.
Do TVALGO's tools show buy and sell signals?
Market Predator plots Buy / Sell signals, Sweeper Algo marks Buy / Sell entry markers after confirmation, and SIX Algo Oscillator alerts only when the candle closes. Bottom Killer plots Buy markers using long-only logic, while Quantum Forge acts when specific conditions are met. Test them on your charts.
Should I combine a buy sell indicator with other tools?
Combine tools by function, not by number. A trend reading, a momentum reading and a separate confirmation, such as volume or structure, come from different calculations. Several tools built from similar moving averages usually agree with each other, which is the same signal counted twice rather than extra evidence.
Trading involves risk, and you can lose money. This article is for education only and is not financial advice. Chart tools show context; they cannot promise any result. Test any setting on your own charts before relying on it. TVALGO is independent and is not affiliated with, endorsed by or sponsored by TradingView.
