
Best TradingView Indicator for Buy and Sell Signals? How to Judge One
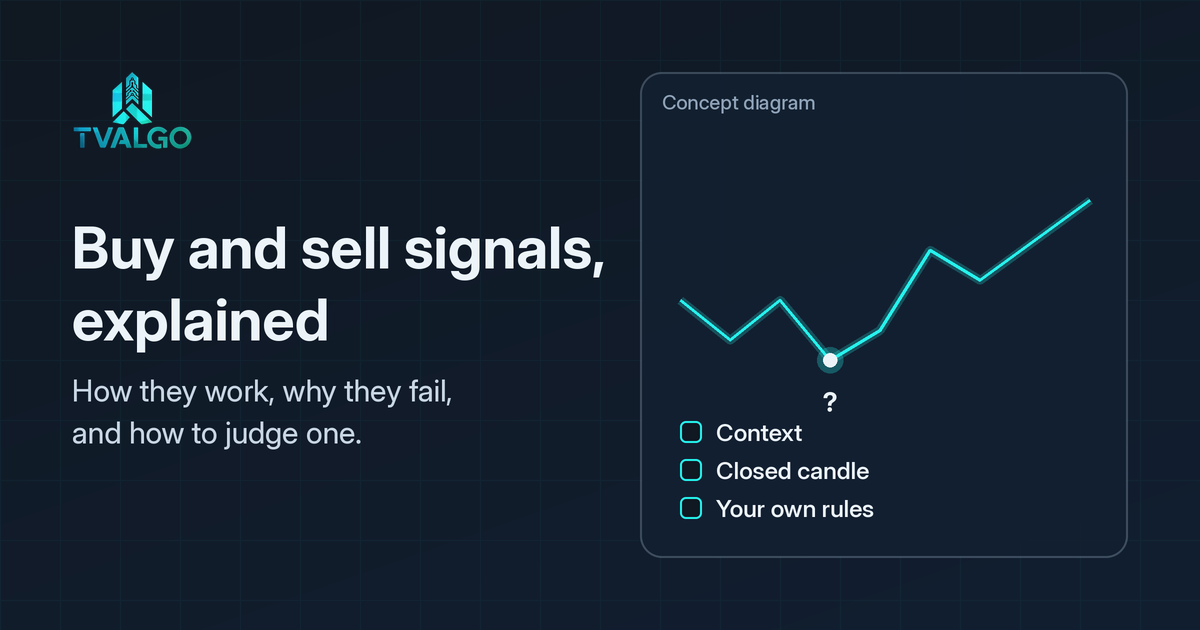
Buying and selling signals on TradingView are chart labels, arrows or colour changes that appear when a rule is met. They are not financial advice, and no rule is right every time. The same signal can look useful on one stretch of history and poor on the next. This guide explains what those labels usually mean, when they confirm after a candle closes, and how to review them on your own charts.
Key takeaways
- A buy or sell signal on TradingView is a rule that fires when price or an indicator meets a condition.
- Common signal families include crossovers, thresholds, breakouts and trend flips.
- Prefer signals that stay where they printed after the candle closes, then test them on your own charts.
- Context tools matter as much as the arrow: regime, structure and extremes change how a signal should be read.
- TVALGO's five tools for TradingView cover extreme-zone, reversal, sweep, regime and momentum context rather than a single universal signal.
What a buy and sell signal actually is
On a chart, a signal is usually an arrow, a label or a colour change that appears when a condition is met. Most TradingView indicators that show buy and sell signals use one of a few families of rules:
- Crossovers: a fast moving average crossing a slow one, or MACD crossing its signal line.
- Thresholds: an oscillator such as RSI moving out of an extreme zone, for example back above 30 or below 70.
- Breakouts: price closing beyond a recent high, low or channel.
- Trend flips: a trailing line such as Supertrend switching from below price to above it.
Many commercial "buy sell" indicators combine several of these with filters. Knowing which family a tool belongs to tells you a lot about where it will struggle: crossovers lag, thresholds fire early in strong trends, and breakouts fail in ranges.
Signal families compared
| Signal family | Typical trigger | Common limitation |
|---|---|---|
| Crossover | A fast average or MACD line crosses a slower reference | Can lag after a move has already started |
| Threshold | An oscillator leaves an extreme zone (for example RSI) | Can fire early while a strong trend continues |
| Breakout | Price closes beyond a recent high, low or channel | False breaks are common in ranges |
| Trend flip | A trailing trend reference changes directional state | Whipsaws when the market has no clear direction |
How trend flips, crossovers and momentum signals differ
A buy or sell label can represent several different calculations. Two indicators may print the same colour while measuring different things.
- Moving-average crossover: A faster average moves above or below a slower one. The event describes the relationship between the averages.
- Trend-following flip: A trend reference, such as an ATR-based band, changes its directional state under the indicator's rules.
- Momentum reading: RSI or MACD describes momentum conditions. A separate rule may be needed to turn that reading into an arrow.
- Price-action breakout: A candle closes beyond a defined swing or range boundary. The interpretation depends on how the boundary was selected.
- Combined conditions: An indicator waits for several criteria to align before displaying a label.
Consider a chart where a faster moving average crosses above a slower one while price remains inside a broader range. The crossover is a valid observation under that rule, but it does not establish that the range has ended.
This is why the calculation behind a label matters more than the label itself.
Best TradingView indicators for buy/sell signals: what to look for
1. Signals that do not repaint
Repainting means a signal changes or disappears after the fact. An indicator that looks into future bars, or that confirms a signal only at the close but draws it earlier, can make historical charts look far better than live trading would have been. Check every signal tool by watching it in real time, or by scrolling back through past bars, and comparing what appeared live with what history shows later.
2. Confirmation on bar close
A signal that appears mid-bar can vanish before the bar closes. Prefer tools that state whether signals confirm on close, and set alerts accordingly.
3. Transparent logic
You do not need the source code, but you should know what the signal responds to: momentum, trend, volatility or price levels. If a seller cannot describe that in plain language, treat the tool with caution.
4. Testability
The most useful signal tools can be turned into alerts or tested with TradingView's Strategy Tester. A tool you cannot test is a tool you can only trust on faith.
5. Fit with your timeframe and market
A signal tuned for a 1-minute crypto chart may produce noise on a daily stock chart, and the reverse. Match the tool to the way you trade.
Check sensitivity, repeated signals and session behaviour
Before comparing two buy/sell indicators, inspect their available inputs.
Some indicators respond more frequently when sensitivity is increased. Others allow the user to adjust trend filters, breakout conditions or the spacing between repeated labels. A different setting can change which events appear without changing the underlying market.
Also check whether the indicator permits several labels in the same direction or requires an opposing condition before another one appears. Some indicators apply session-based rules, while others continue evaluating conditions across sessions.
These features are not universal. The settings panel and the indicator's description should establish which rules actually apply.
Record your chosen inputs before testing. Otherwise, differences between screenshots may reflect a settings change rather than a genuine difference in market conditions.
How a TradingView indicator shows buy and sell signals on the chart
Signals are usually plotted as shapes above or below candles, coloured bars or background shading. Good tools keep this readable: one clear mark per event, a legend that explains each mark, and optional alerts. Poor tools stack several arrows on every swing, which makes it hard to tell which signal you were meant to act on. When you compare tradingview indicators buy sell tools side by side, put them on the same chart and the same timeframe so the comparison is fair.
How to add a buy and sell indicator on TradingView
You can find suitable indicators through TradingView's indicator search. The exact menu names may vary between desktop and mobile versions.
- Open the market chart you want to examine.
- Select Indicators and search for a relevant indicator type.
- Review its description to understand what conditions produce its labels.
- Add it to the chart and open its settings.
- Check the symbol, timeframe, inputs and whether the labels require a completed candle.
- Observe how the indicator behaves across both trending and ranging sections before relying on its readings.
Built-in and community indicators may have different access requirements and configuration options. The presence of an indicator in a catalogue does not establish that every account can use every feature.
How to configure buy and sell alerts
An alert notifies you when a supported condition is met. It does not mean the chart has confirmed a future outcome.
- Open TradingView's Alerts control or the indicator menu.
- Check whether the indicator exposes the relevant buy or sell condition.
- Select the intended condition and review the symbol and timeframe.
- Check the available frequency options. Where appropriate and supported, select confirmation once per bar close.
- Enable the desired notification channel, such as mobile push or email.
- Save the alert and confirm that it appears as active.
Not every indicator provides alert conditions, and available delivery options can vary.
Keep the alert configuration consistent with the chart you are reviewing. If indicator inputs are subsequently changed, verify that the existing alert still reflects the intended settings.
Why buy and sell signals fail
- Lag: any rule based on past prices reacts after the move has started. In fast markets, the best part of a move may be over when the signal prints.
- Whipsaws: in sideways markets, crossover and breakout signals flip back and forth, producing a run of small losses.
- Missing context: a buy signal into a strong higher-timeframe downtrend, or straight into resistance, has a different risk from the same signal in a clean uptrend.
- Cherry-picked examples: marketing screenshots show the best signals. Your results depend on every signal, including the bad ones.
- Costs: spreads, commissions and slippage reduce the result of every trade, especially on short timeframes.
A practical checklist for signals in ranging markets
Sideways conditions can make repeated trend-following crossovers difficult to interpret. A signal may satisfy its calculation while price remains between nearby swing boundaries.
Before interpreting the label, ask:
- Is price establishing a clear sequence of higher highs and higher lows, or lower highs and lower lows?
- Is the signal appearing within a range or after a confirmed change in structure?
- Does the broader timeframe provide similar context?
- Is momentum changing meaningfully, or are several indicators repeating the same information?
- Does the signal remain visible once the relevant candle has closed?
For example, a bullish arrow inside a narrow range may be worth recording as a crossover without treating it as confirmation of a new trend.
Use the same questions when reviewing historical charts. A filter that appears useful in one market condition still needs testing in other conditions.
How to test a buy/sell indicator before you rely on it
A dated companion to this process is the 2027 guide on how to test a buy sell indicator on TradingView, including candle-close versus live-bar behaviour.
- Write the rule down. Which signal, which timeframe, which market, and what invalidates the trade.
- Review a large sample. Scroll through months of history and note every signal, not just the obvious winners.
- Measure more than hit rate. Record the size of wins and losses, the worst run of losses, and the effect of costs. A high percentage of winning signals means little if the losers are much larger than the winners.
- Review past bars carefully. Step through history bar by bar so you see signals the way you would have seen them live.
- Trade small or on paper first. Live conditions reveal problems that history hides.
Check when a signal becomes visible
Historical charts show completed candles. They do not always make it obvious when a particular signal became visible to someone watching live.
Use this additional review process:
- Select a symbol, timeframe and unchanged set of indicator inputs.
- Start from earlier completed candles before a candidate signal appears.
- Advance the chart candle by candle, noting when the label first becomes visible.
- Compare its placement with the candle that actually satisfied the signal condition.
- If alerts are supported, check when the configured alert would become eligible to trigger.
- Repeat the review in a ranging section and a trending section.
Where possible, compare those historical bars with timestamped observations taken during live market activity.
A label that is placed on an earlier candle may have required later information before it could be confirmed. That distinction matters when interpreting historical charts.
Candle-close confirmation addresses unfinished-candle changes, but it does not establish that every indicator's historical behaviour is identical.
Signals versus context
Many experienced traders treat signals as prompts to look closer rather than as orders. They ask: is price at an extreme? Is the structure trending or ranging? Is momentum building or fading? Answering those questions first turns a raw signal into a decision you can explain, including where you would be wrong.
Here is how TVALGO's five tools for TradingView fit that approach:
- SIX Algo Oscillator: colour-coded momentum with alerts on candle close; TVALGO states it does not repaint.
- Bottom Killer: long-only, marks potential buy areas when RSI is oversold.
- Sweeper Algo: marks BUY/SELL entries after a market sweep is confirmed.
- Quantum Forge: rule-based, with a Long/Short/Both direction filter.
- Market Predator: reaction zones with BUY/SELL signals.
Every plan includes all five tools, delivered to your TradingView username. You can read more about extreme zones in our guide to overbought vs oversold on TradingView, and about swings, breaks of structure and sweeps in our market structure guide.
When comparing paid TradingView toolkits, treat buy and sell markers as context to test, not as a ranking.
Compare TVALGO access plans or view all five TVALGO tools.
Use different types of context rather than duplicate readings
Adding more indicators does not necessarily add more independent information.
For example, two indicators based mainly on moving averages may respond to similar price changes. Agreement between them can reflect overlapping calculations rather than separate confirmation.
A more informative chart review compares different questions:
- Structure: Is price trending or ranging, and where are the relevant swing boundaries?
- Momentum: Is directional pressure strengthening, weakening or becoming less clear?
- Volatility: Is the market expanding or contracting?
- Volume: Does the available data show activity consistent with the observed price movement?
Volume requires particular care. Some indicators estimate buying and selling pressure from price movement and reported volume rather than measuring actual transaction-side activity.
Open interest may provide additional context for certain derivatives, but it is not available or relevant in the same way for every instrument.
These observations help organise a chart review without turning several indicators into an instruction to trade.
Trading involves risk, and no analytical tool can guarantee profits or prevent losses.
FAQ
What is the best TradingView indicator for buy and sell signals?
There is no single best one for every trader. Look for signals that do not repaint, confirm on bar close, follow logic you can describe, and hold up when you test them across many months of data, including the losing periods.
Is there a TradingView indicator that shows buy and sell signals?
Many do. Built-in indicators such as moving averages, MACD, RSI and Supertrend can all be read as signal tools, and thousands of community and invite-only indicators plot arrows or labels directly. The label on the chart matters less than the rule behind it.
Are tradingview indicators buy/sell signals reliable?
No signal is reliable on its own. Reliability depends on the market, the timeframe, costs and how the signal is combined with risk management. Test before you trust.
Do TVALGO tools give buy and sell signals?
They mark trade areas: potential buy areas near lows and sell or short areas near highs. Market Predator plots BUY/SELL signals and SIX Algo Oscillator colours momentum green or red. Bottom Killer is long-only and marks Buy entries, Sweeper Algo marks BUY/SELL entries, and Quantum Forge is rule-based with a Long/Short/Both direction filter. Their settings are adjustable and need testing, and no signal is a trade recommendation. Treat every signal as context to evaluate within your own plan, not as an instruction to buy or sell.
Best TradingView indicators buy sell signals: how do I compare them?
Put each candidate on the same chart, market and timeframe, list every signal over the same period, and compare the size of wins and losses, the worst losing run and the effect of costs. Keep the one whose behaviour you understand and can live with, not the one with the best-looking screenshots.
Is a high win rate enough to choose a signal indicator?
No. A win rate says nothing about the size of the losses, the number of trades tested, drawdowns or trading costs. Judge a tool on the whole picture.
How do I add a buy and sell indicator on TradingView?
Open a TradingView chart, select Indicators and search for a built-in or community indicator that displays signals. Add it, read its description and check the signal rules, inputs and timeframe. Then watch completed candles before assuming the plotted labels are actionable. The exact control names can vary by platform and version.
How do I set up alerts for buy and sell signals?
Open the chart's Alerts control or the indicator menu and look for an available alert condition. Select the relevant event, review the symbol and timeframe, choose a firing frequency such as once per bar close where supported, and enable the notification method you want. Save and check the alert status. Some indicators do not expose alert conditions.
What is the difference between a trend flip and an EMA crossover?
A trend-band flip describes a change in a volatility-adjusted trend reference, while a moving-average crossover describes two averages changing their relative order. They can appear at different points because their rules use different inputs. Neither event proves that a new trend will persist. Compare the candle close and the surrounding swing structure before interpreting the label.
How do I filter buy and sell signals in sideways markets?
Start by identifying whether price is ranging or trending on the timeframe you use, then compare nearby swing highs and lows and the broader timeframe. If several indicators measure similar momentum, their agreement may not provide independent confirmation. Review how signals behave during sideways periods by scrolling back through past bars with consistent settings. Filtering can reduce clutter without removing uncertainty.
Why can a buy or sell arrow disappear before the candle closes?
A live candle can temporarily meet an indicator condition and then fail it before closing. The arrow may disappear as that unfinished candle changes. Use completed historical bars and timestamped live observations to check when the mark first appeared and whether the alert was set to wait for bar close. Candle-close confirmation reduces one source of confusion but does not establish that every indicator behaves the same way.
This article is for educational purposes only and is not financial advice. TVALGO provides technical-analysis software; it does not guarantee results, execute trades or provide personalised advice. Trading involves risk, and you can lose money. Read our risk disclosure before using any trading tool. TVALGO is independent and is not affiliated with or endorsed by TradingView.