
TradingView Indicator Checklist: 10 Points for 2027
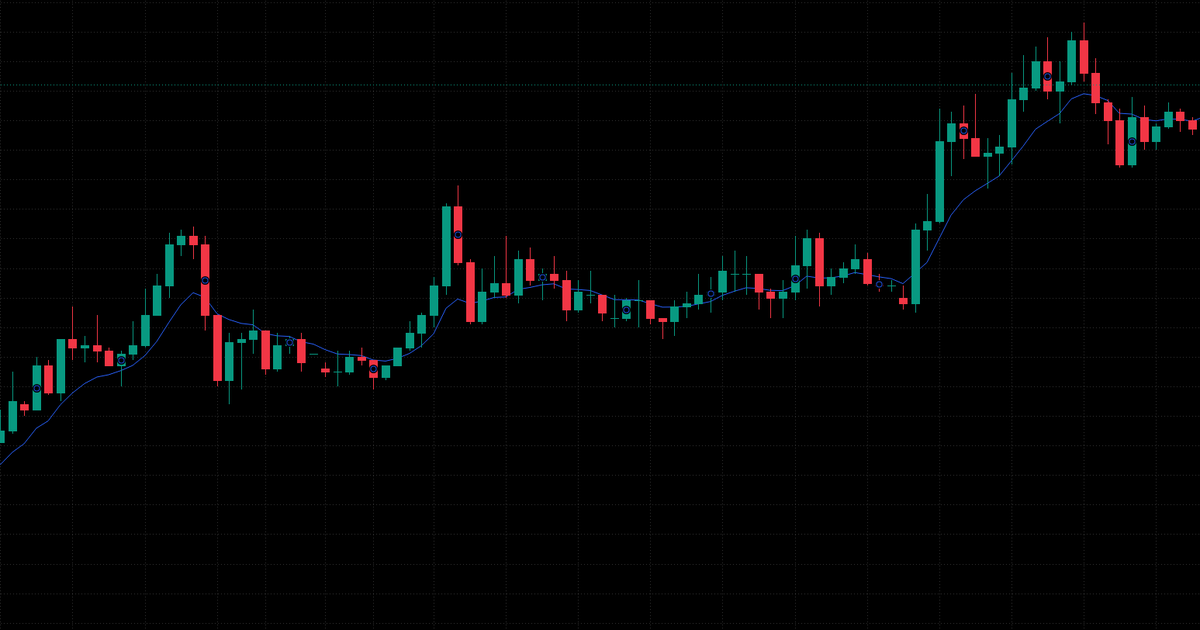
To choose a TradingView indicator, use a checklist rather than a ranked list. The right choice is the tool that answers a clear chart question, behaves consistently after candle close and passes your checks on the market and timeframe you use. Compare evidence and terms, not rankings or marketing claims.
Key points
- Choose a tool for the chart question you actually need to examine.
- Use a bar-by-bar review of past price and live observation to check whether completed markers change.
- Check candle-close behaviour, alerts, plan limits and adjustable settings.
- Read the seller's access, billing, renewal and cancellation terms before paying.
Quick answer: how to choose a TradingView indicator
There is no universal shortlist. Someone studying momentum may need different information from someone examining volume, volatility or possible turning areas. Choose by the chart question you need answered and the behaviour you can verify on your own charts.
This is a dated checklist for planning a 2027 setup, not a claim of new features or rule changes. Apply it to built-in indicators, community offerings and paid products, and re-check plan limits and seller terms before buying.
Why "top 10" lists age quickly
Ranked indicator lists are often built for a particular audience, market or style. Their value is limited if the author does not explain the selection criteria, testing conditions or date checked.
Rankings also mix products that answer different questions: momentum, volume or possible reversal context, for example. For a 2027 decision, use a list only to generate questions. Check purpose, confirmation behaviour, settings, access and terms rather than assuming a ranking proves suitability.
The 10-point checklist for any TradingView tool
Compare each option on the same basis and keep notes. A polished chart image should not replace your own review.
| # | Check | What to look for |
|---|---|---|
| 1 | The question it answers | A clear purpose and understandable chart output. |
| 2 | Repainting | Confirmed historical markers remain in place. |
| 3 | Candle close | Clear explanation of live and confirmed readings. |
| 4 | Alerts | Trigger conditions and timing are explained. |
| 5 | Plan limits | Fits the indicator allowance on your TradingView plan. |
| 6 | Settings | Adjustable controls and their purpose are documented. |
| 7 | Testing | You can review it on your own market and timeframe. |
| 8 | Documentation and support | Clear instructions and an identifiable support route. |
| 9 | Billing and cancellation | Written price, renewal date and cancellation terms. |
| 10 | Access | The delivery method and account requirements are clear. |
1–3: The question it answers, repainting and candle close
First, identify the job: momentum, volume, volatility, trend context or possible reversal areas. The seller should explain what appears and why it may be useful. If the purpose is unclear, comparison becomes guesswork.
Next, check repainting. A confirmed marker should not move, disappear or appear retrospectively on a completed candle. Use a bar-by-bar review of past price and live observation. A marker that appears at candle close and then stays is delayed confirmation, not automatically repainting.
Finally, check candle-close behaviour. A reading on an unfinished bar can change while it forms. Find out whether a condition is evaluated live or only after close; these are different events.
4–6: Alerts, plan limits and settings
Check how alerts are triggered. Some conditions can be set to fire once per bar close. Compare alert timing with the marker left on the chart and confirm which alert condition you selected.
According to TradingView's pricing page, checked 4 Nov 2026, the Basic plan allows two indicators per chart. Limits can change, so re-check before planning a 2027 layout and count the indicators already in use.
Read what adjustable settings do before changing them. Make changes deliberately, note them and test the resulting display again. More controls do not automatically mean a better fit.
7–10: Testing, documentation, billing and access
Test on the market and timeframe you follow. Review different chart sections and observe live behaviour; one brief review does not settle every use case.
Documentation should explain chart output, confirmation timing, settings and limitations. Check that the seller identifies who provides the product and how to get access or billing support.
Before paying, find the price per period, renewal date, cancellation method and what happens to access after cancellation. Check delivery steps and required account details before checkout.
How to run a bar-by-bar repaint check
A bar-by-bar review moves through historical candles one at a time. Compare what an indicator displayed as each candle became available with the completed chart. Chart controls may vary between TradingView versions, so use the controls shown in your current chart interface.
- Choose your usual market and timeframe, then open a historical section.
- Start before a marker appears and advance one candle at a time.
- Note when the marker first appears and whether the candle has closed.
- Continue forward and watch whether the confirmed marker disappears or moves.
- Compare those historical bars with the completed chart and, where available, alert timing.
Repeat in different chart sections. One example cannot establish every condition. If the seller's explanation does not match what you observe, ask for clarification before relying on the display.
TradingView plan limits to know before 2027
TradingView's pricing page, checked 4 Nov 2026, stated that the free Basic plan allows two indicators per chart. This is a plan limit, not a recommendation. The allowance may change, so verify it again for 2027.
Count what is already on your layout. Compatibility with TradingView does not mean every plan has the same indicator capacity.
Built-ins, community indicators and paid tools
TradingView's built-ins may already cover your chart needs. Paid tools may offer a defined display, settings or access arrangement, but the label alone does not establish suitability. Read our guide to judging free TradingView indicators.
Widely known built-ins include moving averages, RSI, MACD, Bollinger Bands, volume and VWAP. Assess community offerings and paid products by purpose, confirmation behaviour, settings and terms. For buy and sell markers, see how to judge TradingView buy and sell signals.
Red flags in indicator marketing
Marketing should explain what a product displays and how to assess it. Be cautious when claims outweigh the explanation or access and billing questions remain unanswered.
- Promises of a particular win rate or accuracy without a clear, independently checkable method.
- "Never repaints" wording from a seller who provides no practical way to check the claim.
- Historical screenshots presented as the only evidence, with no explanation of live behaviour.
- Unclear prices, billing periods, renewal dates or cancellation terms.
- No stated way to stop future renewals or find out what happens to access afterwards.
- Requests for your TradingView password, one-time code or brokerage login.
Never share account credentials for chart access. A seller should explain the required username or account identifier without asking for passwords or security codes.
How TVALGO's tools fit
TVALGO does not rank itself above other providers. Apply the same checklist to its five tools: understand the purpose, review the settings and test the chart behaviour on your own market and timeframe.
SIX Algo Oscillator: extreme-zone and momentum context; its alerts trigger only when the candle closes.
Market Predator: momentum and pressure context.
Bottom Killer: potential bottoming and reversal context.
Sweeper Algo: liquidity sweeps and structure context; it acts after confirmation using next-candle logic.
Quantum Forge: structured market-condition analysis.
TVALGO confirms that its tools do not repaint and are not lagging. Access is invite-only and added manually to your TradingView username within 12 hours after successful payment and username validation. Cancelling stops future renewals, while access continues until the end of the period already paid for. The tools work on free and paid TradingView plans, on any market and timeframe.
Frequently asked questions
How do I choose a TradingView indicator?
There is no fixed list for every trader. The right choice depends on your market, timeframe and chart question. Use the checklist to compare repainting, candle-close behaviour, alerts, settings, testing, documentation and seller terms before choosing what fits your process.
Is a top 10 list a good way to choose an indicator?
A fixed top-ten list cannot fit every market, timeframe or process. Use the ten checks here instead of treating a ranking as a recommendation. Confirm each option's purpose, observe its live behaviour and read its access and billing terms.
What are the most popular indicators on TradingView?
Widely known built-ins include moving averages, RSI, MACD, Bollinger Bands, volume and VWAP. This is not a ranking. Familiarity does not prove suitability; choose based on the chart information you need and your own testing.
How many indicators can I use on TradingView's free plan?
TradingView's pricing page stated that the free Basic plan allowed two indicators per chart when checked on 4 Nov 2026. Limits can change, so re-check before 2027 and count the indicators already on your chart.
Is there a most accurate TradingView indicator?
No indicator is the most accurate for every market and timeframe. The answer depends on what is assessed, the conditions tested and how the result is defined. Marketing is not a substitute for documentation, live observation and repeatable testing.
How can I check whether a TradingView indicator repaints?
Scroll back through past bars to move through candles one at a time and note when markers appear. Observe the same market live and check whether confirmed markers remain on completed candles. Compare alert timing with the final chart, then repeat across different chart sections.
How many indicators should I combine?
Use one tool per question: trend, momentum, volatility or volume. Two similar oscillators, such as RSI and Stochastic, usually repeat the same information, so their agreement is not independent confirmation. A small set from different categories keeps the chart readable and easier to test.
Should I include costs when testing an indicator?
Yes. If you test a rule in TradingView's Strategy Tester, enter realistic commission and slippage in the strategy properties, because a test without costs can look better than live conditions allow. Then check the unchanged rule on a later period it was not tuned on.
Trading involves risk, and you can lose money. This article is for education only and is not financial advice. Chart tools show context; they cannot promise any result. Test any setting on your own charts before relying on it. TVALGO is independent and is not affiliated with, endorsed by or sponsored by TradingView.
