
Free TradingView Indicators: An Honest Guide to Judging Them
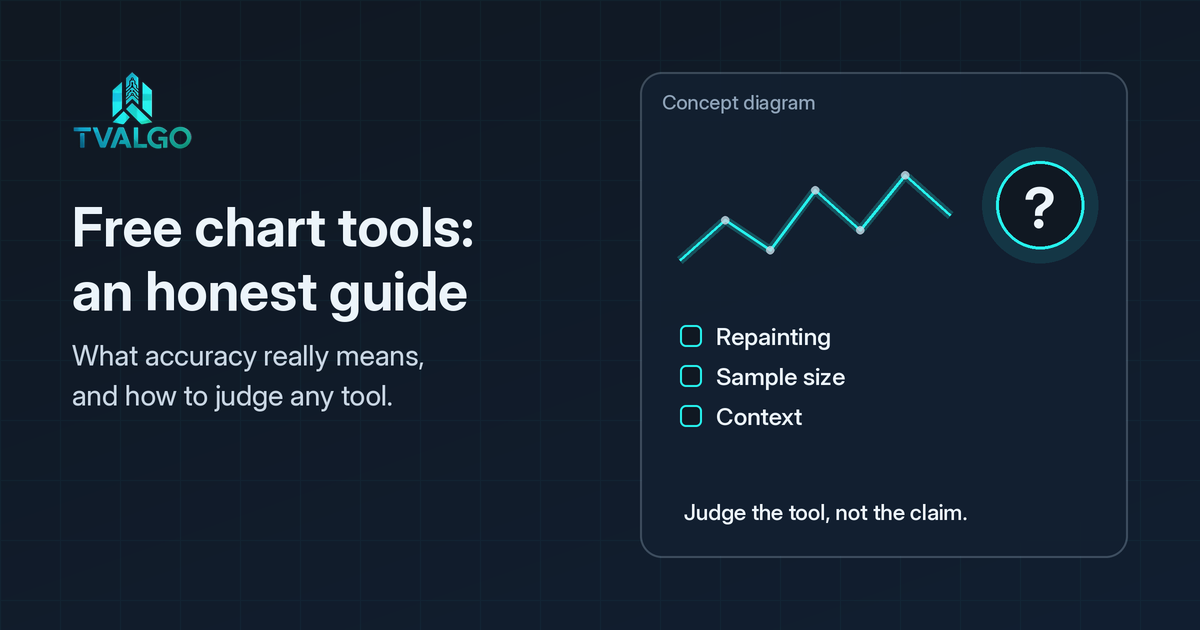
Searching for the best free indicator on TradingView is a sensible place to start. Free tools cost nothing to try, and TradingView's built-in library is extensive. The honest answer, though, is that no indicator, free or paid, is the best in general. Usefulness depends on what the indicator measures, the market and timeframe you use it on, and how you define a correct reading in the first place. This guide explains what reliability really means for an indicator, what free built-in tools do well, where they fall short, and how to judge any indicator before you rely on it.
Is there a best TradingView indicator?
No single indicator is the best for everyone. An indicator is a calculation applied to past prices, and sometimes volume. It summarises what has already happened in a particular way. A moving average summarises direction, RSI summarises momentum, ATR summarises volatility. Each can be useful, and each will be wrong in conditions it was not designed for. A trend tool struggles in a sideways market; a range tool struggles in a strong trend.
So instead of looking for the best indicator, it is more productive to look for the indicator that answers the question you are actually asking, on the market and timeframe you actually trade.
What "reliability" means for an indicator
Claims of reliability are hard to compare because the word can mean several different things:
- How a correct reading is defined: correct over the next candle, the next hour or the next week? The same reading can look right on one horizon and wrong on another.
- Lag: most indicators are calculated from past data, so they confirm moves after they start. Faster settings reduce lag but increase false readings. There is always a trade-off.
- Repainting: if an indicator changes its past readings after the fact, its history looks more reliable than it ever was in real time.
- Sample size: a tool that looks reliable on a handful of examples may not hold up across hundreds of occurrences and different market conditions.
- Selection: screenshots and showcase charts tend to show the best moments. Reliability only means something when every occurrence is counted.
What free TradingView indicators do well
TradingView includes a large set of built-in indicators at no extra cost, and many experienced traders rely mainly on them. They cover the core questions well:
- Direction: moving averages show the prevailing direction and act as dynamic reference levels.
- Momentum: RSI, Stochastic and MACD show whether moves are strengthening or fading.
- Volatility: ATR and Bollinger Bands show how far price typically moves and when it is unusually quiet or active.
- Participation: volume, VWAP and volume profile show where trading activity is concentrated.
Built-in indicators are well documented, widely understood and transparent about their calculations. That transparency is a real strength: you know exactly what you are looking at.
The limits of free indicators
Free indicators also have practical limits worth knowing about:
- One question at a time: most built-ins measure a single thing. Combining several into a coherent view is left to you, and a crowded chart is easy to misread.
- Default settings: standard settings were not chosen for your market or timeframe. Tuning them carefully takes time, and tuning them too much leads to overfitting.
- Community indicators vary widely: TradingView's public library contains excellent work alongside indicators that repaint, are no longer maintained or describe themselves in exaggerated terms. Quality is not guaranteed either way.
- No support: if a free community indicator behaves unexpectedly, there may be no one to ask.
Free vs paid: what you are actually paying for
A paid indicator is not necessarily more reliable than a free one, and you should be wary of any seller who implies that it is. What a paid tool can reasonably offer is different: a particular way of combining information, a consistent design, documentation, updates and someone to contact when you have a question. Whether that is worth paying for depends on how you trade and how much time you want to spend building and maintaining your own setup.
The same standards should apply to both. A paid tool deserves exactly the same scrutiny as a free one: clear logic, no repainting, readings that confirm on candle close, and evidence that holds up when you test it yourself.
If you are weighing paid invite-only options, see this overview of LuxAlgo alternatives for access and billing notes from official pages.
How to judge any indicator, free or paid
- Name the question it answers. Direction, momentum, volatility, participation or levels. If you cannot name it, the tool is hard to use well.
- Check for repainting. Watch the tool live or scroll back through past bars and study how its readings behaved candle by candle, then compare what appeared in real time with what the chart shows later.
- Count every occurrence. Review a long stretch of history and record every reading, including the unconvincing ones.
- Include costs and context. Spreads, commissions and the higher-timeframe picture all change how a reading plays out.
- Forward test. Use the tool on paper, or with very small size, before giving it real weight.
Our guide to choosing a TradingView indicator for scalping covers why a headline win rate alone is not enough, and our article on judging buy and sell signals goes through signal testing step by step.
Where TVALGO fits
TVALGO is a paid subscription, not a free tool, and it does not claim to be the best tool on TradingView. Every plan includes five TVALGO tools for TradingView, each designed to add a specific kind of context to your own analysis:
- SIX Algo Oscillator: extreme-zone and momentum context.
- Bottom Killer: potential bottoming and reversal context.
- Sweeper Algo: liquidity sweeps and structure context.
- Quantum Forge: structured market-condition analysis.
- Market Predator: momentum and pressure context.
If the free built-ins already answer your questions, they may be all you need. If you want a combined view of extreme zones, structure and momentum, you can compare plans or read the FAQs. For background on the concepts, see our guides to overbought vs oversold and market structure on TradingView.
FAQ
What is the best free indicator on TradingView?
There is no single best one. Each built-in indicator measures something different, and its usefulness depends on your market, timeframe and how you define a correct reading. Choose the indicator that answers your question, then test it properly.
Are free TradingView indicators good enough?
For many traders, yes. The built-in indicators are transparent and well documented, and they cover direction, momentum, volatility and participation. Their limits are practical: they measure one thing at a time, and combining them well takes time and care.
How many indicators can I use on TradingView's free plan?
On TradingView's free Basic plan, you can add up to 2 indicators per chart, according to TradingView's pricing page. Choose two that answer different questions, such as direction and momentum, rather than two that measure the same thing. Plan limits can change, so check TradingView's current plan page.
Do paid indicators perform better than free ones?
Not necessarily. Price is not evidence of reliability. Judge a paid tool by the same standards as a free one: clear logic, no repainting, readings that confirm on candle close and results that hold up in your own testing.
Is TVALGO free?
No. TVALGO's five tools are part of a paid subscription. You can see the current plans on our pricing page.
How can I check whether an indicator repaints?
Watch it in real time and note where its readings appear, then look back later to see whether they have moved or disappeared. Scrolling back through past bars and studying how each candle printed makes this easier to check.
This article is for educational purposes only and is not financial advice. TVALGO provides technical-analysis software; it does not guarantee results, execute trades or provide personalised advice. Trading involves risk, and you can lose money. Read our risk disclosure before using any trading tool. TVALGO is independent and is not affiliated with or endorsed by TradingView.