
Best TradingView Indicator for Scalping: How to Choose One
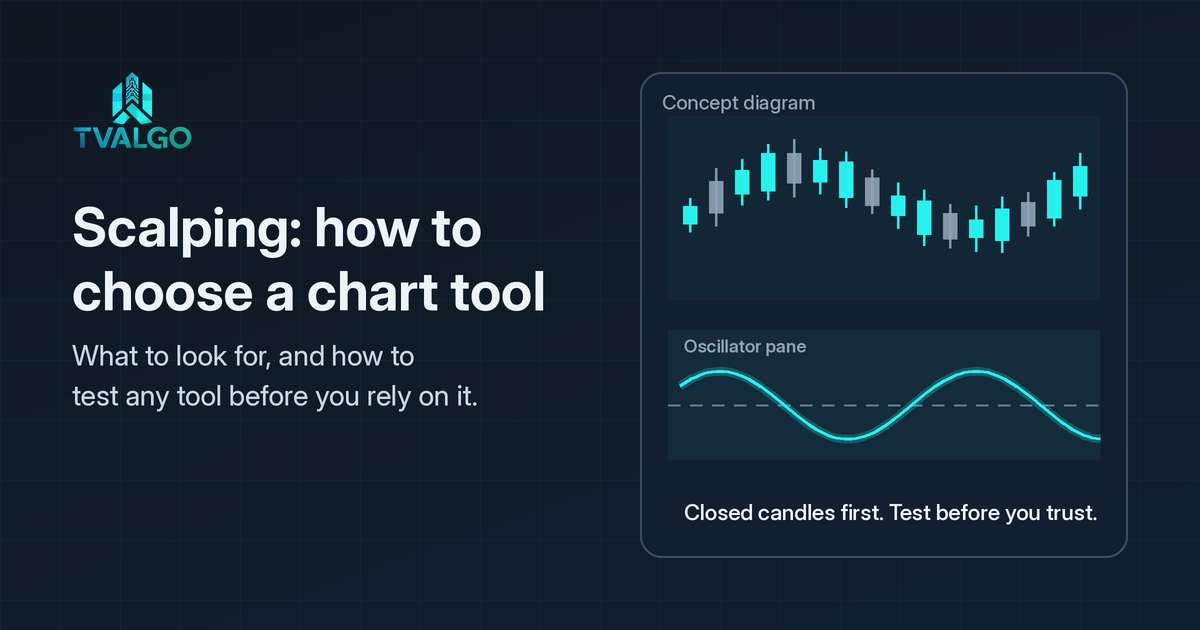
If you are searching for the best TradingView indicator for scalping, it helps to change the question slightly. There is no single indicator that suits every scalper, market and session. A more useful question is: which indicator gives me a clear, honest reading on very short timeframes, and how do I check that before I rely on it? This guide explains what scalping asks of an indicator, the main types scalpers use on TradingView, why an advertised win rate tells you less than it seems, and a simple way to test any tool before you trust it.
What scalping asks of an indicator
Scalping means taking short-lived positions on low timeframes, often the 1-minute to 5-minute chart, and aiming to capture small price movements. That changes what matters. On a daily chart, a few seconds of delay or a slightly noisy reading hardly registers. On a 1-minute chart, the same delay can be the whole move, and the same noise can produce several false readings in a row.
Two further pressures are easy to underestimate. First, trading costs: spreads, commissions and slippage are paid on every trade, so the more often you trade, the larger their share of the outcome. Second, attention: a scalper makes many decisions quickly, so a cluttered chart is not just untidy, it slows you down at the moment speed matters most.
What to look for in a scalping indicator
1. Readings that confirm on candle close
Many indicators update while a candle is still forming. A reading that appears mid-candle can disappear before the close. For short timeframes, prefer tools that make clear whether their readings confirm on close, and set any alerts to trigger on close rather than intrabar.
2. No repainting
Repainting means a past reading changes after the fact. A tool that repaints can make historical charts look far cleaner than live trading would ever have been. Watch a tool in real time, or scroll back through past bars and study how each signal behaved candle by candle, then compare what you saw live with what the chart shows later.
3. A reading you can describe in one sentence
You do not need the source code, but you should be able to say what the tool responds to: momentum, trend, volatility, volume or price levels. If you cannot explain what a reading means, you cannot judge when it is likely to be wrong.
4. Low clutter
Two or three complementary readings usually beat eight overlapping ones. Several oscillators built on similar maths will often agree with each other, which can feel like confirmation when it is really the same information repeated.
5. A fit with your market and session
A setting that behaves well on a liquid currency pair during the London session may be noisy on a thin market or during quiet hours. Match the tool and its settings to where and when you actually trade.
Common indicator types scalpers use on TradingView
Most scalping setups draw on a few familiar families, all available as built-in indicators on TradingView:
- Moving averages: short exponential moving averages show the short-term direction and act as a reference for pullbacks. They lag by design, which matters more on fast charts.
- VWAP: the volume-weighted average price for the session gives a reference for whether price is trading rich or cheap relative to the day's activity. It is most meaningful in markets with reliable volume data.
- Oscillators such as RSI and Stochastic: these show momentum and stretched conditions. On low timeframes they reach extreme readings often, so an extreme on its own is context rather than a reason to act.
- Volatility tools such as ATR and Bollinger Bands: these help you see whether the market is moving enough to be worth scalping after costs.
- Volume: rising volume behind a move suggests participation; a move on fading volume deserves more caution.
None of these is the best on its own. Each answers a different question, and the useful combinations are the ones where each tool adds something the others do not.
Why a win rate alone is not enough
Many scalping indicators are marketed with a headline win rate. It is an appealing figure because it is easy to understand, but on its own it tells you surprisingly little. Before you give it any weight, ask these questions:
- How many trades is it based on? A figure from a few dozen trades can be luck. A figure from a large sample across different market conditions means more.
- How large were the losses compared with the wins? A tool can win most of the time and still lose overall if its occasional losses are much larger than its typical wins.
- What was the drawdown? The deepest fall from a peak, and how long recovery took, says more about whether you could live with a method than a single percentage does.
- Were costs included? For scalping, spreads, commissions and slippage can turn a result that looks positive on paper into a negative one in practice.
- How was it tested? Results measured on the same data used to choose the settings are usually flattering. Results on unseen data, or from forward testing, are far more informative.
- Was the tool overfitted? Settings tuned until the past looks perfect often stop working when conditions change.
- Does it repaint? If past readings move after the fact, any historical win rate is unreliable by definition.
A headline number without this context is marketing, not evidence. That applies to every tool, including any you are already using.
How to test an indicator before you rely on it
- Write your rule down. Which reading, which timeframe, which market and which session, and what would tell you the idea was wrong.
- Review past bars carefully. Step through history candle by candle so you see each reading the way you would have seen it live, not with hindsight.
- Record every occurrence. Note every time your rule applies, not just the memorable ones, and include costs.
- Forward test. Run the rule on paper, or with very small size, for a meaningful period. Live conditions expose problems that history hides.
- Keep a journal. Record what you saw, what you did and why. Over time, the journal tells you more about a tool than any marketing claim.
Common scalping mistakes
- Overtrading: treating every reading as an instruction. Fewer, clearer decisions usually hold up better once costs are counted.
- Stacking similar tools: adding a third or fourth momentum oscillator rarely adds new information.
- Ignoring the session: the hour after a major market opens behaves very differently from quiet periods. Check session times in your own time zone, and remember they shift when UK and US clocks change. In winter, for example, the London open at 08:00 UK time is 13:00 in Pakistan, and the New York stock market open at 09:30 New York time is 19:30 in Pakistan.
- Ignoring higher-timeframe context: a 1-minute reading against a clear higher-timeframe trend or into a major level carries different odds from the same reading in a clean setting. Our market structure guide explains how to read that context.
- Changing settings after every loss: constant tweaking is overfitting in slow motion.
Where TVALGO tools fit
TVALGO tools for TradingView are built to add context to your own analysis, not to replace it. For short-term work, two are most relevant: SIX Algo Oscillator provides extreme-zone and momentum context, and Market Predator provides momentum and pressure context. Neither is a scalping system, and no reading is a recommendation to trade. As with any tool, test them on your own market and timeframe before relying on them. You can read more about stretched conditions in our guide to overbought vs oversold on TradingView, and about judging signals in how to judge buy and sell signals.
Compare plans or read the FAQs.
FAQ
What is the best TradingView indicator for scalping?
There is no single best one. A good scalping indicator confirms on candle close, does not repaint, gives a reading you can explain, and holds up when you test it on your own market, timeframe and session, with costs included.
Is a high win rate enough to trust a scalping indicator?
No. A win rate says nothing about the size of the losses, the number of trades behind it, drawdowns, trading costs or how the test was run. Judge a tool on the whole picture, not on one headline figure.
Which timeframe is best for scalping on TradingView?
Most scalpers work between the 1-minute and 5-minute charts, often with a higher timeframe for context. The right choice depends on the market, its typical spread and your ability to make decisions quickly. Shorter timeframes mean more noise and a larger share of costs.
Do TradingView indicators repaint, and why does it matter for scalping?
Some do. A repainting indicator changes past readings after the fact, which makes historical charts look better than live use would have been. On short timeframes the effect is magnified, so check any tool by watching it live or by scrolling back through past bars.
Can I use TVALGO tools for scalping?
You can add them to any timeframe, but they are designed to provide context, such as extreme-zone, momentum and pressure readings, rather than scalping signals. Whether they suit your approach is something to test for yourself.
This article is for educational purposes only and is not financial advice. TVALGO provides technical-analysis software; it does not guarantee results, execute trades or provide personalised advice. Trading involves risk, and you can lose money. Read our risk disclosure before using any trading tool. TVALGO is independent and is not affiliated with or endorsed by TradingView.